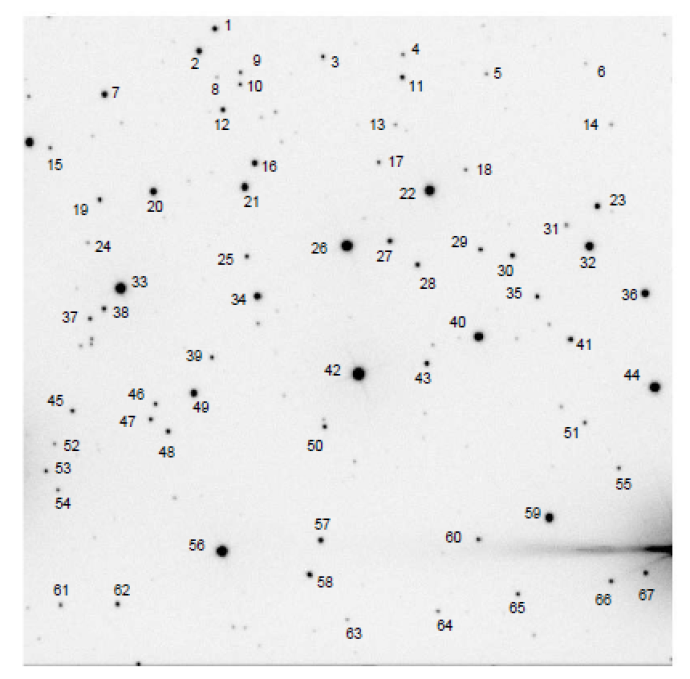
A finder chart is a map of a small region of the sky. Astronomers use these charts to find particular stars within an image.
The charts are also useful for communicating which object on a map is being referred to.
Being able to find the same star in two observations is important. The easiest way of collecting data for a set of stars is to do so in the order in which the stars are numbered on the chart.

Let’s use the example of creating a colour-magnitude diagram. These diagrams show the relationship between a star’s colour and its brightness. The colour index of a star is calculated from 2 measurements of the same star. Each measurement is taken using a different filter (usually B and V). A finder chart helps us match up the 2 sets of measurements and avoid errors.
There are various quick and easy ways to create a finder chart:
- You could print off the image and write the numbers on the map using a pen.
- You could save the image as a picture (like a jpeg) and use an image editing program to add numbers.
- You could use a FITS viewer like DS9 to annotate your image.
