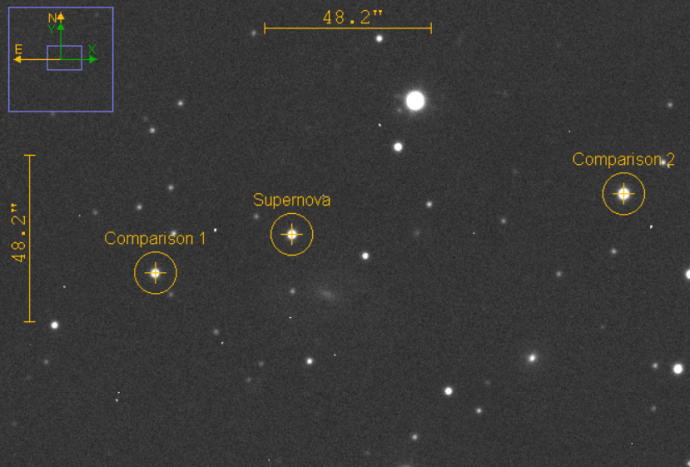
Supernovae are exploding stars which increase in brightness very suddenly and unexpectedly.
We need you to help us analyse data collected by the Gaia Space Telescope. By measuring the brightness of a supernova and plotting how it changes over time, you will help us understand more about these powerful stellar objects.
By the end of this activity you will:
- Have used software to view and analyse real data
- Have done photometry on several stars (measured how bright they are)
- Have created a light curve for a supernova (a plot of brightness over time)
To complete this activity you will need:
- The Supernovae project webpages
- The Gaia16agf data files (download zip file)
IT Equipment
- Access to the internet
- MS Excel and the Magnitude Calculator spreadsheet - if you are new to spreadsheet software, use this MS Help Sheet
- Image Software that can open astronomical data files
Files or Documents
Document
MS-Excel-Help-Sheet_0.pdf
(5.68 MB)
Credit
Document
Magnitude calculator.xlsx
(19.88 KB)
Credit
Document
Gaia16agf data.zip
(217.12 MB)
Credit
Image

Credit
This work
by The Schools' Observatory
is licensed under All rights reserved
